A Comparative Analysis of PMDC with variation in its parameters
The responses here obtained are very limited in their expressions in the sense that they do not provide the comparative results between the responses if any parameter is changed.
For the accomplishment of the fore mentioned task separate .m files were created each varying one parameter i.e. Resistance, R; Inductance, L; Inertia of the load and the motor system, J and the damping of the load and the motor system, B.
The results are based on the fact that each of the above mentioned parameters are changed one by one and the response of the motor and the behavior of the natural frequency and the damping ratio of the whole system are plotted are against them.
Variation in:
- Resistance, RImportant Observations:
Step Response of the system
- As the resistance of the system is in creased the overall response of the system to the step input that is the output angular velocity of the system decreases.
Frequency response of the system
- The break frequency slightly changes its value when the value of the resistance is changed.
Current Response
- The steady state values and the peak values of the current decreases drastically as the system’s resistance is changed (increased), upon the application of step input.
Current’s frequency response
The magnitude of the current in the in the steady state upon the application of a sinusoidal input decreases as the resistance is increased, and so the break frequency.
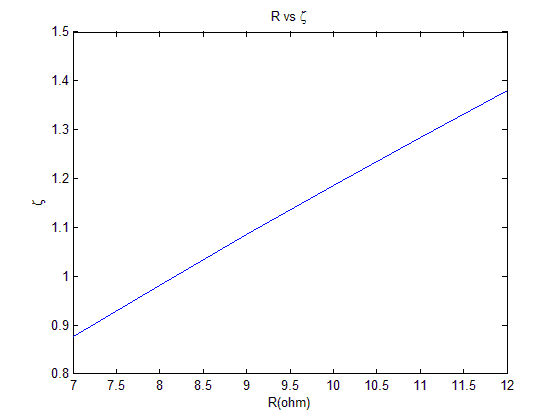
Damping ratio vs. resistance characteristics
- Upon increasing the resistance of the system the damping ratio defined for the system also increases, i.e. the system slow down will be faster as the system’s resistance is increased.
- Also notice that the system response at higher resistive values is highly over damped response, which may not be suitable for certain applications.
Break frequency vs. resistance characteristics
- It is evident from the accompanied graph that the break frequency increases as the system resistance is increased, though the change is small.
The following series of characteristics describes the behavior of the necessary parameters of a system such as rise time, tr; peak time, tp; maximum overshoot, Mp and the settling time for the step response of the system. It is important to note that some of the quantities do not need to be calculated in certain responses like maximum overshoot doesn’t have any significance under the over damped or critical response of a system. The important observations are summarized below the characteristics. Upon increasing the resistance of the system generally the following is noticed:
- The rise time decreases.
- Peak time decreases.
- Maximum overshoot decreases.
- Settling time decreases.
The increase in the resistance can cause the system response to become more and more over damped, thus, increasing the efficiency of the system. Thus, resistance parameter should be appropriately chosen while designing a system, keeping system response in mind.


Comments
Post a Comment